A good starting point for understanding Windows is to understand its Event Logging System. Through these, we will obtain a real image of the computer.
Through them, we will get the answers to all the doubts that windows can generate.
Through them, hopefully, we will achieve a new technical skill, either from the vision of a Blue Team, or from the vision of a Blue Team, in charge of understanding events outside the organisation. As offensive team personnel, to perform intrusions in a healthy and opsec way.
To get down to business, every process that occurs in windows is stored in these logs, even events that are generated without starting a session. That would be for example the winlogon process.
All these events will show us relevant information, for example:
- All successful and unsuccessful logon attempts
- Attempts to clear audit logs
- System errors
- New system service creation
- File access
- Process creation…
And many others, let’s get started !!
Windows Auditing Event Flow
Within the security subsystem, we have two main parts. These are the User Mode and the Kernel.
The obtaining of information in windows, takes place in different ways, both have a series of components that differentiate them.
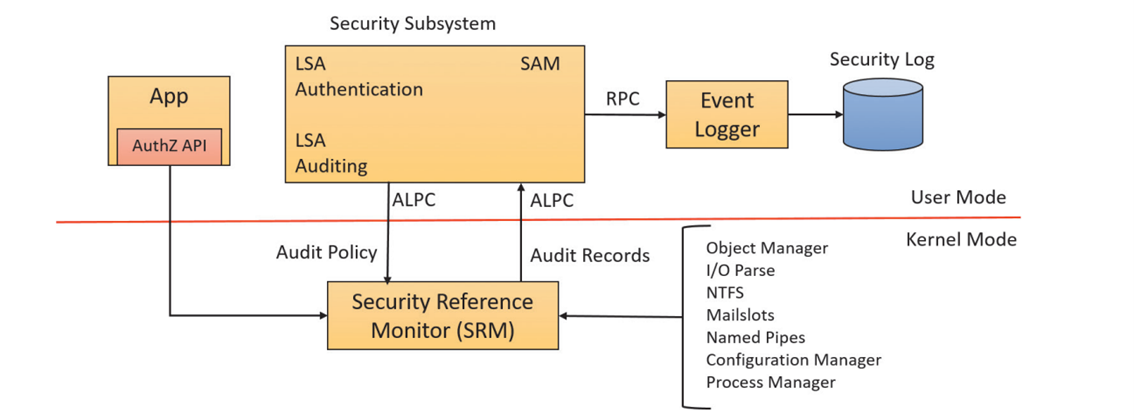
We have two main components, inside User-Mode we have LSASS.EXE, an internal process that inside it run the LSA modules, Local Security Authority service (Lsasrv.dll), it is the database where the registry policies are stored and it is in charge of sending security events to the event log, for example, events related to successful or failed session starts.
And the SAM service, which is responsible for the administration of User accounts.
And within the Kernel-Mode, NTOSKRNL.exe, also known as the System process. We have the Security Reference Monitor, SRM, one of the many functions it has is to generate any resulting security audit messages.
Both processes have multiple functionalities, not only for the purpose of sending logs. They have a major influence on the operation of windows, for example SRM, is responsible for defining the access token data structure to represent a security context, performing security access checks on objects
The process for reporting an event is as follows:
1. Generation of Security Events
In an initial phase, the various Windows components, such as System Processes and services, make use of authZ.dll to generate security events.
This event generation is carried out through the use of specific functions, the most prominent of which are AuthzReportSecurityEvent() or AuthzReportSecurityEventFromParams (). These functions allow components to report the occurrence of relevant security events.
2. Communication with LSASS.exe
Once the security events are generated, communication with LSASS.exe is initiated. To achieve this, the RPC (Remote Procedure Call) communication protocol is used. The “LSASS.exe” interface is responsible for handling the requests from these event-generating functions.
This is where the LSASS interface comes into play, acting as an intermediary to receive and process the RPC requests coming from the components, allowing the transfer of data.
3. Transfer to Windows Event Logger
LSASS plays a crucial role in the transfer of security events to the Windows Event Logger, where these events will be logged and stored for further analysis. There are two ways in which LSASS performs this transfer:
-
Through the use of AdvApi32.dll, LSASS.exe uses the ReportEvent() function to send the events to the Windows Event Log Service. This enables events to be documented in the Windows event logs, providing a historical trace of the relevant security activities.
-
When making use of private functions, LSASS.exe calls the NTDLL.dll library to send the events to the Kernel-mode via the ETW component. This process involves the communication of events captured from user-mode applications to the Kernel-mode, where they are processed by the ETW component. The ETW component, in turn, enqueues and sends the events to the Windows event log service as fast as the service allows.
Event Tracing for Windows (ETW)
There is some very interesting information already created, and well documented, I recommend you to read the following publications:
- https://blog.palantir.com/tampering-with-windows-event-tracing-background-offense-and-defense-4be7ac62ac63
- https://bmcder.com/blog/a-begginers-all-inclusive-guide-to-etw
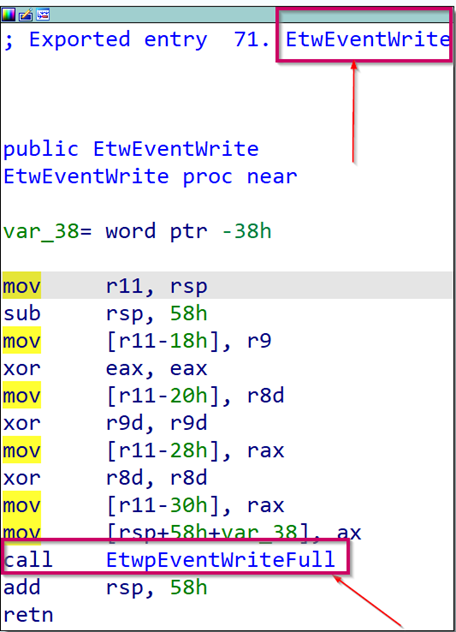
Within the user-mode environment, the EtwWriteEvent() EtwEventWriteEx and EtwEventWriteFull functions, which are methods exported by the ntdll library, are called when a user-mode program wants to log an event.
These functions use the NtTraceEvent function to transition to kernel mode.
The data flow would be as follows EtwWriteEvent/Ex/Full ==> NtTraceEvent ==> ETW
graph TD;
    EtwWriteEvent-->NtTraceEvent;
    EtwWriteEventEx-->NtTraceEvent;
    EtwWriteEventFull-->NtTraceEvent;
    NtTraceEvent-->ETW;
And finally The Windows Event Log service writes events to the security event log. Actually EtwWriteEvent calls EtwpEventWritefull, it should be like a private function inside the core
As shown in the picture, multiple functions make use of NtTraceEvent.
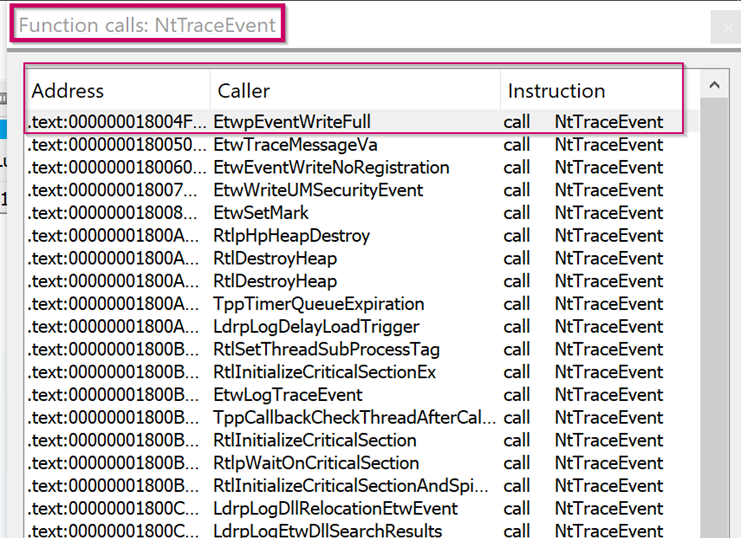
One of the techniques to disable ETW is to patch one of these functions.
This technique consists of modifying the data stream by patching the EtwEventWrite WinAPI or NtTraceEvent with a RET instruction (0xC3), stopping any useful ETW-related telemetry from being generated related to this process.
This would be one of the codes that we may encounter
int main() {
	DWORD dwOld = 0;
	FARPROC ptrNtTraceEvent = GetProcAddress(LoadLibrary("ntdll.dll"), "NtTraceEvent");
	VirtualProtect(ptrNtTraceEvent, 1, PAGE_EXECUTE_READWRITE, &dwOld);
	memcpy(ptrNtTraceEvent, "\xc3", 1);
	VirtualProtect(ptrNtTraceEvent, 1, dwOld, &dwOld);
	return 0;
}
The patch is simply force a return when the NtTraceEvent function is called NtTraceEvent
In particular, these tools implement similar techniques:
This technique is well known y the most important limit is that this attack will only patch event raised in usermode. As advocates we need to monitor these functions and identify if the value has been modified.
There are other techniques such as
- Hooking
- ETW provider – Session Hijacking
- Patchless ETW bypass via hardware breakpoints
Used by command and controls like Havoc & BruteRatel
hardware breakpoints
It’s really interesting how this technique works, as well as its understanding and complexity are totally out of the look of the blog or what I intended it to be.
As an introduction:
To understand it, we need to know how breakpoint software works, when a debugger uses a software breakpoint, what it does is overwrite the first byte of the instruction at the specified address.
The INT3 instruction is a one-byte-instruction defined for use by debuggers to temporarily replace an instruction in a running program in order to set a code breakpoint.
This instruction is equivalent to the 0xCC opcode on both 32-bit and 64-bit systems We can say, Hardware breakpoints work in the same manner, the difference is that once a breakpoint is specified at an address, this address will be stored in one of the available debug registers, Dr0,Dr1,Dr2 y Dr3.
The implementation of Havoc here
The Windows operating system relies strongly on ETW as a means to log andmonitor its activity.
Most Windows components contain one or more ETW providers that provide information about the component’s performance TheNT kernel is no exception with a wide set of providers covering many areas of the system
There are two types of providers in the kernel:
- system trace providers (trace events happening inside the kernel related to devices, filesystem, network, processes and memory, independent of the state of any standard providers)
- standard providers (they provide a much wider variety of information about the system) They provide a separate pathway to trace events happening inside the kernel related to devices, filesystem, network, processes and memory, independent of the state of any standard providers
From the kernel mode point of view, it will take care of reporting security events occurring in the processe in NTOSKRNL.EXE., known as Windows NT Operating System Kernel Executable.
It hosts most of the code that is in kernel mode. It includes mostly the various “managers”: Object Manager, Memory Manager, I/O Manager, Plug & Play Manager, Power Manager, Configuration Manager
The kernel implementation of ETW is done via the EtwTi functions, where Ti represents “threat intelligence”.
Read:
Today, ETW is widely used by endpoint detection and response (EDR) solutions. These security solutions subscribe to ETW events to detect and prevent attacks in real-time. In order to fully patch ETW a driver must be used. Fortunately, ETW structures are not monitored by KPP and can be patched without triggering a BSOD
Useful Providers
There are more than 1,000 providers in windows 10. Some interesting ones like:
- Microsoft-Windows-Kernel-Process: This ETW provider is instrumental in monitoring process-related activity within the Windows kernel. It can aid in detecting unusual process behaviors such as process injection, process hollowing, and other tactics commonly used by malware and advanced persistent threats (APTs).
- Microsoft-Windows-Kernel-Network: This ETW provider offers visibility into network-related activity at the kernel level. It’s especially useful in detecting network-based attacks such as data exfiltration, unauthorized network connections, and potential signs of command and control (C2) communication.
- Microsoft-Windows-DotNETRuntime: This provider focuses on .NET runtime events, making it ideal for identifying anomalies in .NET application execution, potential exploitation of .NET vulnerabilities, or malicious .NET assembly loading.
- Microsoft-Windows-PowerShell: This ETW provider tracks PowerShell execution and command activity, making it invaluable for detecting suspicious PowerShell usage, script block logging, and potential misuse or exploitation.
Detectar .NET Assembly
One of the techniques most commonly used by the C&C strategy is the “execute-assembly” command implemented in CobaltStrike. CobaltStrike’s ‘execute-assembly’ command allows the user to execute .NET assemblies directly from memory. This means that an executable or DLL does not need to be written physically to the disk
How does execute-assembly work? The technique is known as fork and run, launch a new process and then inject a dll in that process
The Cobalt Strike implementation will:
- Spawn a temporary process
- Load the .NET CLR (Command Language Runtime) into that process. Libraries like clrjit.dll / clr.dll are loaded.
- Execute the given .NET assembly in memory of that process.
- Get the output and kill the process.
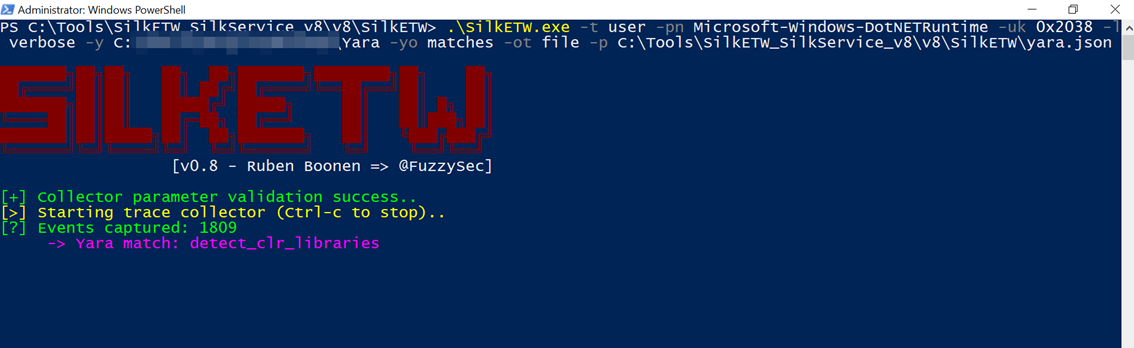
Monitoring the loading of such libraries can help reveal attempts to execute .NET assemblies in unusual or unexpected contexts, which can be a sign of malicious activity. In the next image, on the left-hand side
1. Execute Seatbelt with the argument TokenPrivileges
2. Execute SilkETW, with this argumentes:
SilkETW.exe -t user -pn Microsoft-Windows-DotNETRuntime -uk 0x2038 -ot eventlog
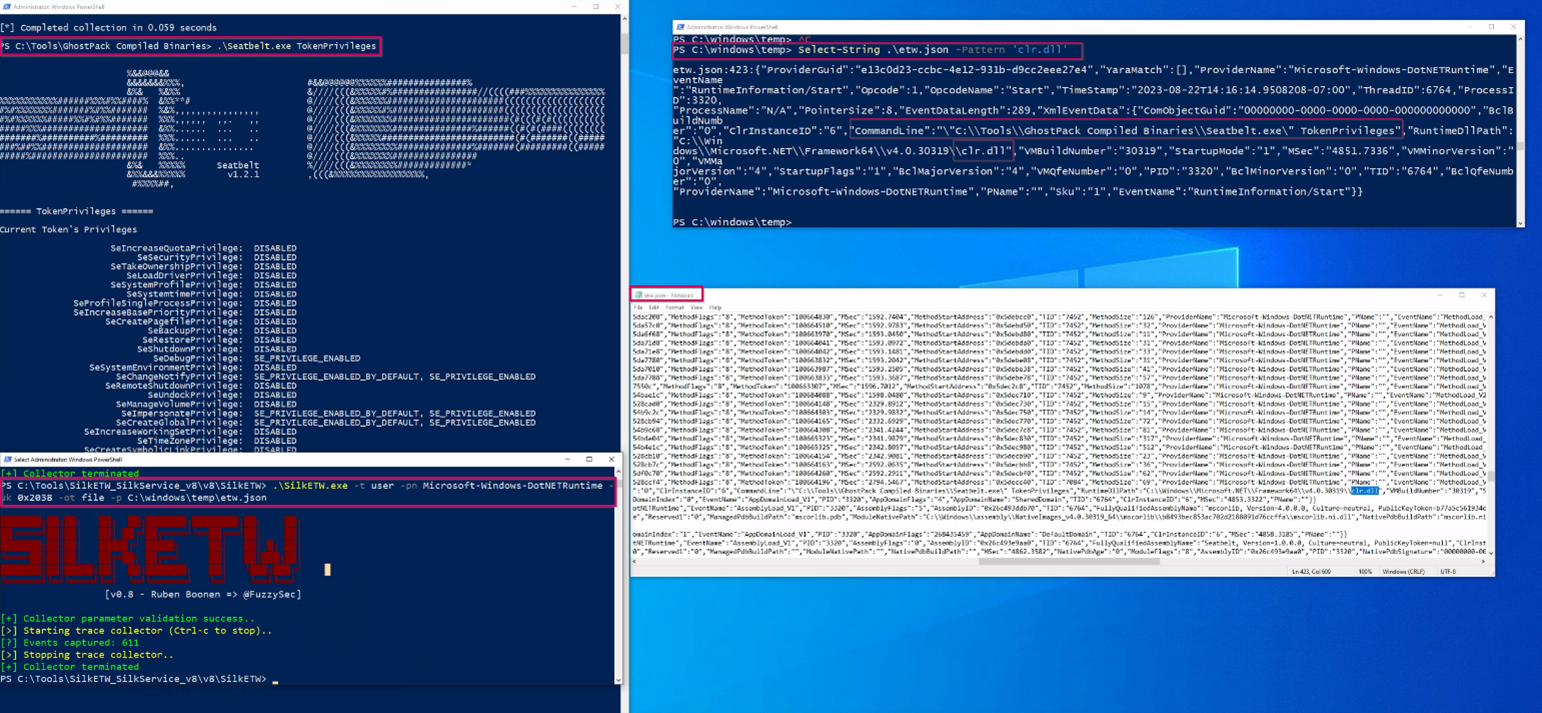
Right side we see the logs generated, identifying the clr.dll library.
We can include yara rules to increase the detection of these libraries. To detect the use of the clrjit.dll & clr.dll libraries, you can create a YARA rule like the following:
rule detect_clr_libraries {
    strings:
        $clrjit = "clrjit.dll"
        $clr = "clr.dll"

    condition:
        any of ($clrjit, $clr)
}
.\SilkETW.exe -t user -pn Microsoft-Windows-DotNETRuntime -uk 0x2038 -l verbose -y C:\Users\Sergio\Desktop\Yara -yo matches -ot file -p C:\Tools\SilkETW_SilkService_v8\v8\SilkETW\yara.json
This rule called “detect_clr_libraries” looks for the strings “clrjit.dll” and “clr.dll” in a file or process and will trigger detection if either of these strings is found.
One way to avoid this style of detection is to set the process to a .NET assembly & there are plenty that exist on Windows by default.
Detecting Strange Parent-Child Relationships
This technique enables malicious processes to evade detection methods based on the parent-child relationship and inherit access tokens from the parent process to elevate privilege. we need to have elevated rights in order to create a process from the parent process handle The visibility we have with event viewer is limited, even using tools like Sysmon we will not be able to detect the parent process.
I will use the following tool:
https://github.com/decoder-it/psgetsystem/blob/master/psgetsys.ps1
The tool works as follows:
First step, Obtain the list of attributes of a process, with the objective of obtaining the information that a process stores, such as the associated token, threads among others, such as statupinfo, this provides essential configuration for process creation.
To create this list of attributes we will use InitializeProcThreadAttributeList(), this function will be called twice, in a first occasion, to obtain the size of the list of attributes and for a later initialization.
An intermediate step, between these two calls, is to create a handle to the Parent Process ID that we want to spoof.
Finally, we update the attributes with UpdateProcThreadAttribute.
And then, we call the CreateProcessFromParent() function, passing the arguments of our parent process and the executable we want to launch. The most common options are launching a cmd or powershell
PS C:\Tools> [MyProcess]::CreateProcessFromParent(1384,"C:\Windows\System32\cmd.exe","")
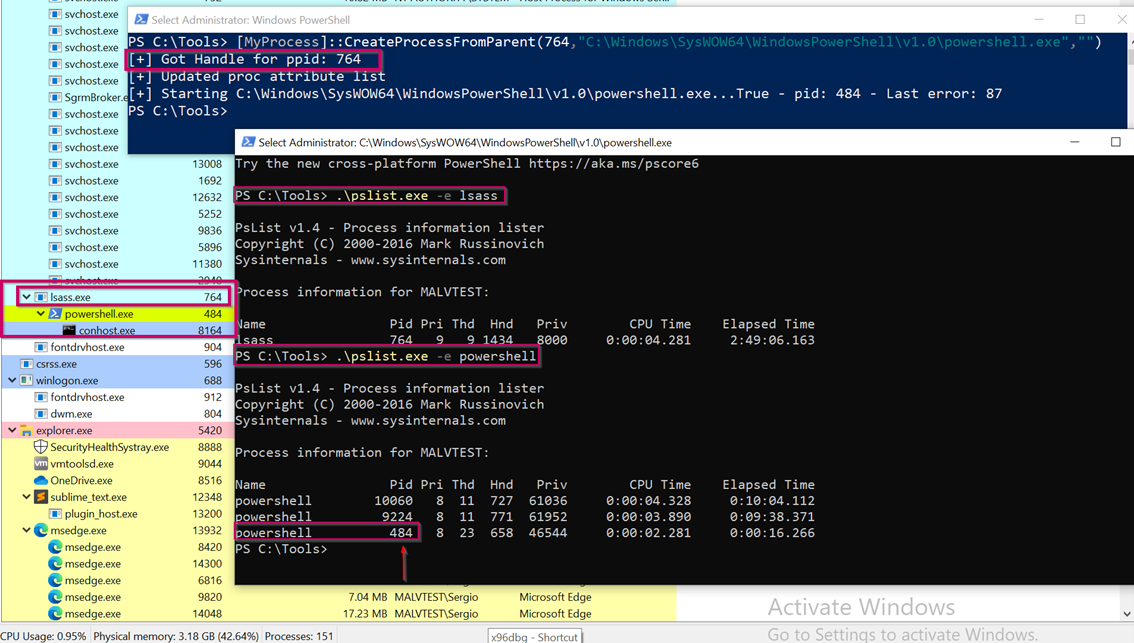
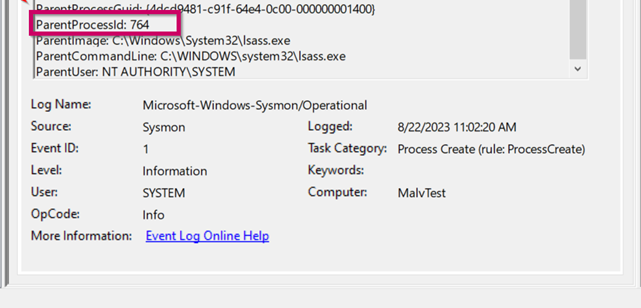
Due to the parent PID spoofing technique we employed, Sysmon Event 1 incorrectly displays lsass.exe as the parentImage of powershell.exe. However, it was actually powershell.exe that created powershell.exe.
The only way that seems to be available is for kernel drivers that register for process creation notifications with PsSetCreateProcessNotifyRoutineEx (or one of its variants). When such a notification is invoked in the driver
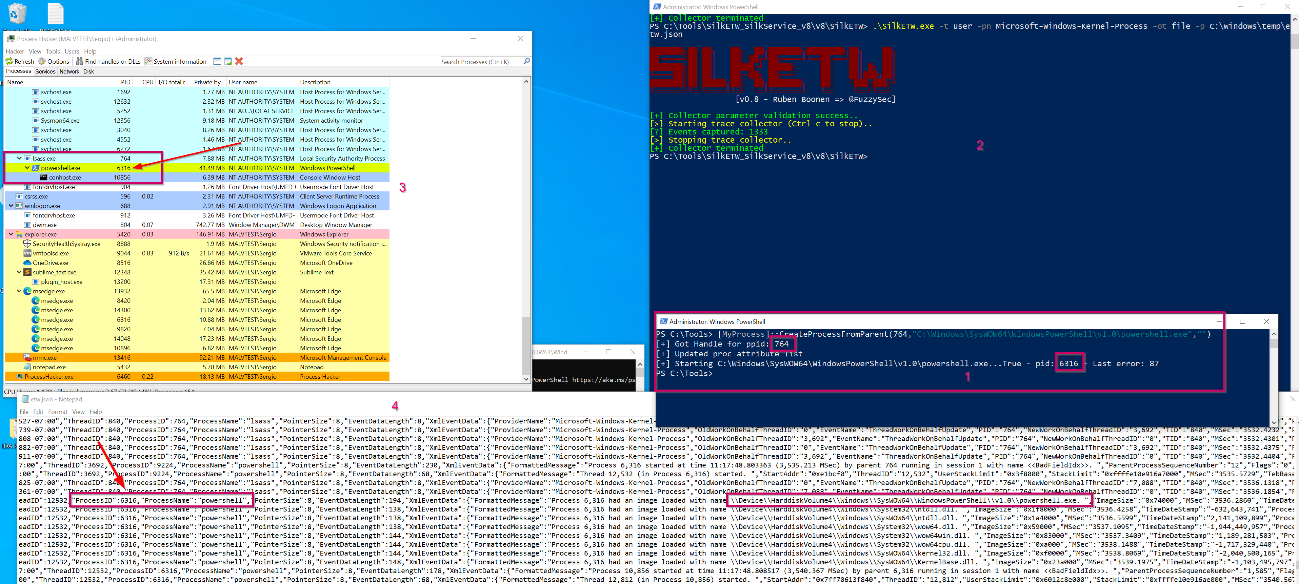
Using ETW we can see how in the logs, the process name is correctly running in powershell.
Sysmon
System Monitor (Sysmon) is a Windows system service and device driver that remains resident across system reboots to monitor and log system activity to the Windows event log. Sysmon provides detailed information about process creation, network connections, changes to file creation time, and more.
Sysmon’s primary components include:
• A Windows service for monitoring system activity.
• A device driver that assists in capturing the system activity data.
• An event log to display captured activity data.
Sysmons events and configuration => https://learn.microsoft.com/en-us/sysinternals/downloads/sysmon
Sysmon helps us to increase the visibility and traceability of our equipment.
Event ID 1: Process creation
- Traceability of a process, this first process will be associated to a session logon.
Event ID 2: A process changed a file creation time
- This event helps tracking the real creation time of a file. Attackers may change the file creation time of a backdoor to make it look like it was installed with the operating system.
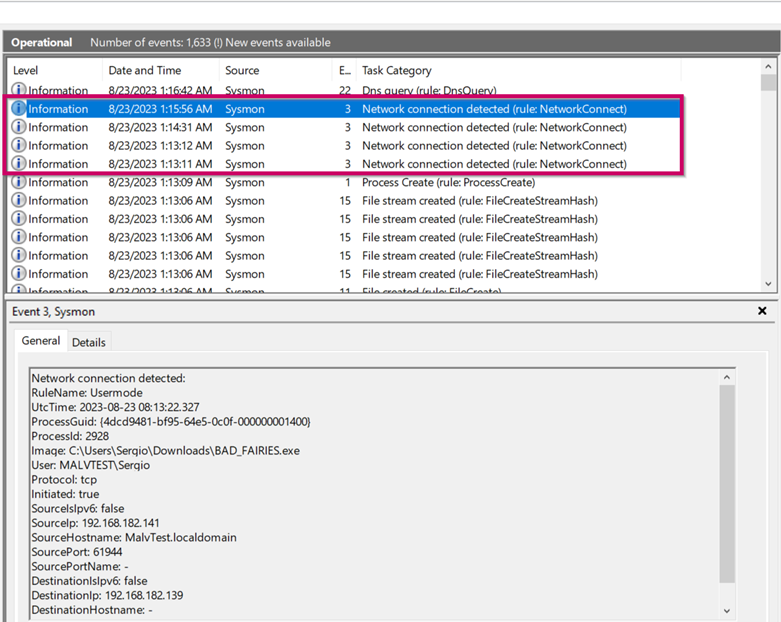
Event ID 3: Network connection
- The network connection event logs TCP/UDP connections on the machine. Example using Sliver C&C
Event ID 4: Sysmon service state changed
- Modifying the Sysmon service is known as a technique to hide in the network.
Event ID 5: Process terminated
- Traceability of a process
Event ID 6: Driver loaded
- It informs us when a driver is loaded. Loading a driver is used to have the necessary permissions to modify ETW or modify the driver of an EDR. Mimikatz, for example, loads a driver into the system.
Event ID 7: Image loaded
- DLL Injection Detection
Event ID 8: CreateRemoteThread
- Sysmon will log EventID 8 for all processes that use the Win32 API CreateRemoteThread call. Very common function to load shellcodes or process injection, allows you to start a thread in a process other than your own
Event ID 9: RawAccessRead
Event ID 10: ProcessAccess
- This enables detection of hacking tools that read the memory contents of processes like Local Security Authority (Lsass.exe). For example, dumpear the database with mimikatz
Event ID 11: FileCreate
- Trazabilidad
Event ID 12,13,14: RegistryEvent (Object create and delete) - (Value Set) - (Key and Value Rename)
- Monitor Windows Registry
Event ID 15: FileCreateStreamHash
Event ID 16: ServiceConfigurationChange
- Privilege Escalation / Persistence
Event ID 17/18: PipeEvent (Pipe Created) & (Pipe Connected)
- Communication with the C&C
Event ID 19,20,21: WmiEvent (WmiEventFilter activity detected) - (WmiEventConsumer activity detected) - (WmiEventConsumerToFilter activity detected)
Wmi is uses for: Discovery Execution commandos, Persistencia, Evasion, C&C communication, Lateral Movement, Exfiltration
- Bitdefender-Whitepaper-WMI: A Decade of WMI Abuse – an Overview of Techniques in Modern Malware
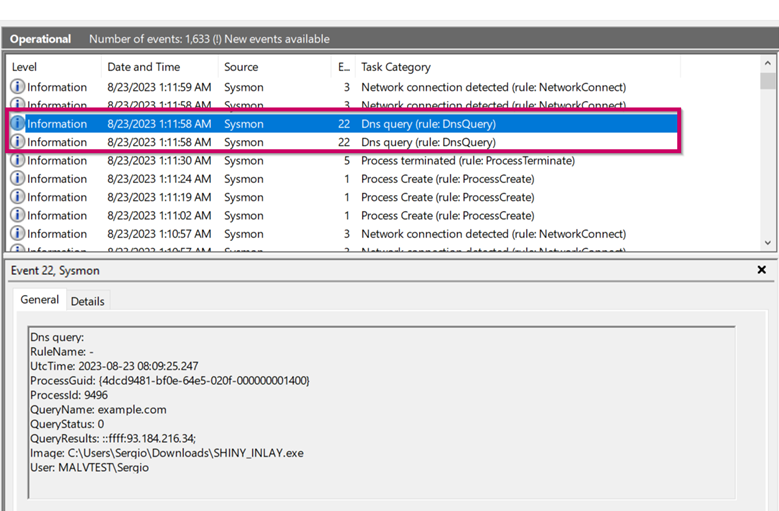
Event ID 22: DNSEvent (DNS query)
- Communication with the C&C Example using a Sliver
Event ID 23: FileDelete (File Delete archived)
-
- Traceability, identifying which information is removed by attackers, such as tools
Event ID 24: ClipboardChange (New content in the clipboard)
Event ID 25: ProcessTampering (Process image change)
Event ID 26: FileDeleteDetected (File Delete logged)
Event ID 27: FileBlockExecutable
Event ID 28: FileBlockShredding
Event ID 29: FileExecutableDetected
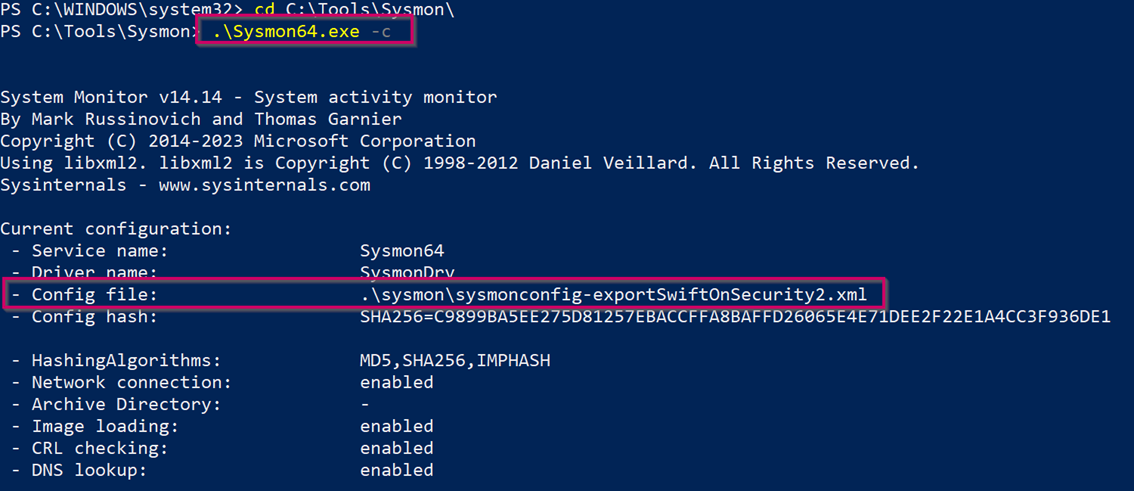
Regarding the security of Sysmon, we must evaluate what rules exist within the configuration file:
- Identifying the configuration
sysmon -c will show us the location of the file
Matt Graeber together with Lee Christensen gave a talk in 2018 at blackhat => slides and more information
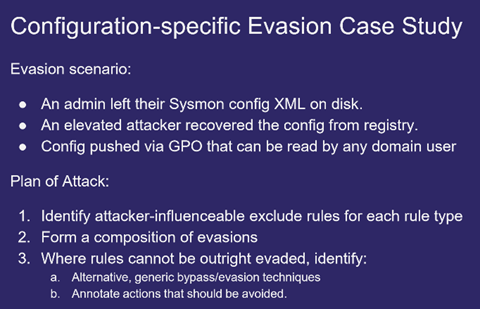
is ideal to focus on exclude rules. The rationale should be evident – any exclude rule that an attacker can get their tradecraft to match on will not be logged.
-	Blending in with exclude rules. Exclude rules that will be the most valuable are “Image” and “CommandLine” rules
-	Avoiding rules present in include rules.
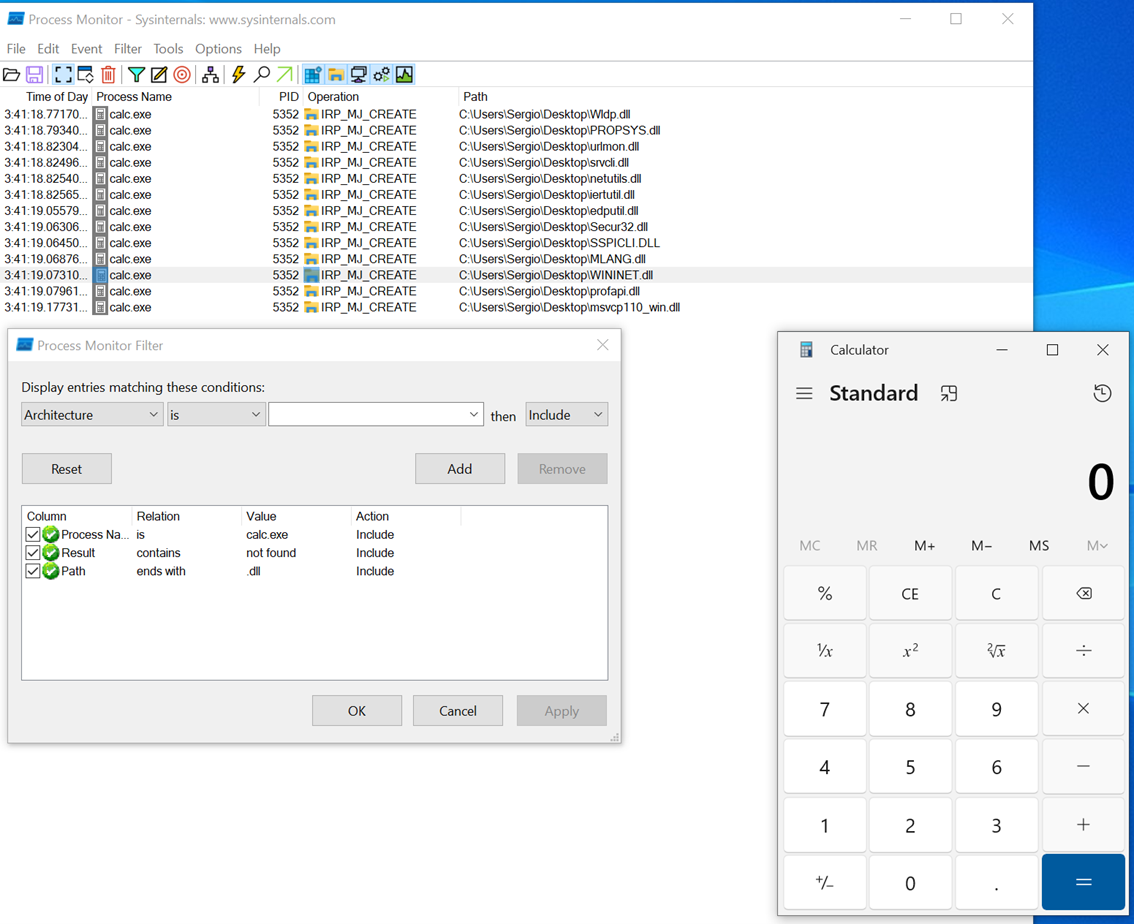
Detection Example 1: Detecting DLL Hijacking
1º Find vulnerable DLL
In this example, we know that calc.exe is vulnerable to dll sideloading, through the process monitor tool, we detect that dlls are not found.
DLL search order hijacking: DLLs specified by an application without a path are searched for in fixed locations in a specific order [3]. Hijacking the search order takes place by putting the evil DLL in a location that is searched in before the actual DLL. This sometimes includes the working directory of the target application.
We will use this example from stephenfewer https://github.com/stephenfewer/ReflectiveDLLInjection/blob/master/bin/reflective_dll.x64.dll
The steps are, change the name for WININET.dll & download to the same path que calc.exe
Let’s now see how a Sysmon event ID 7 looks like.
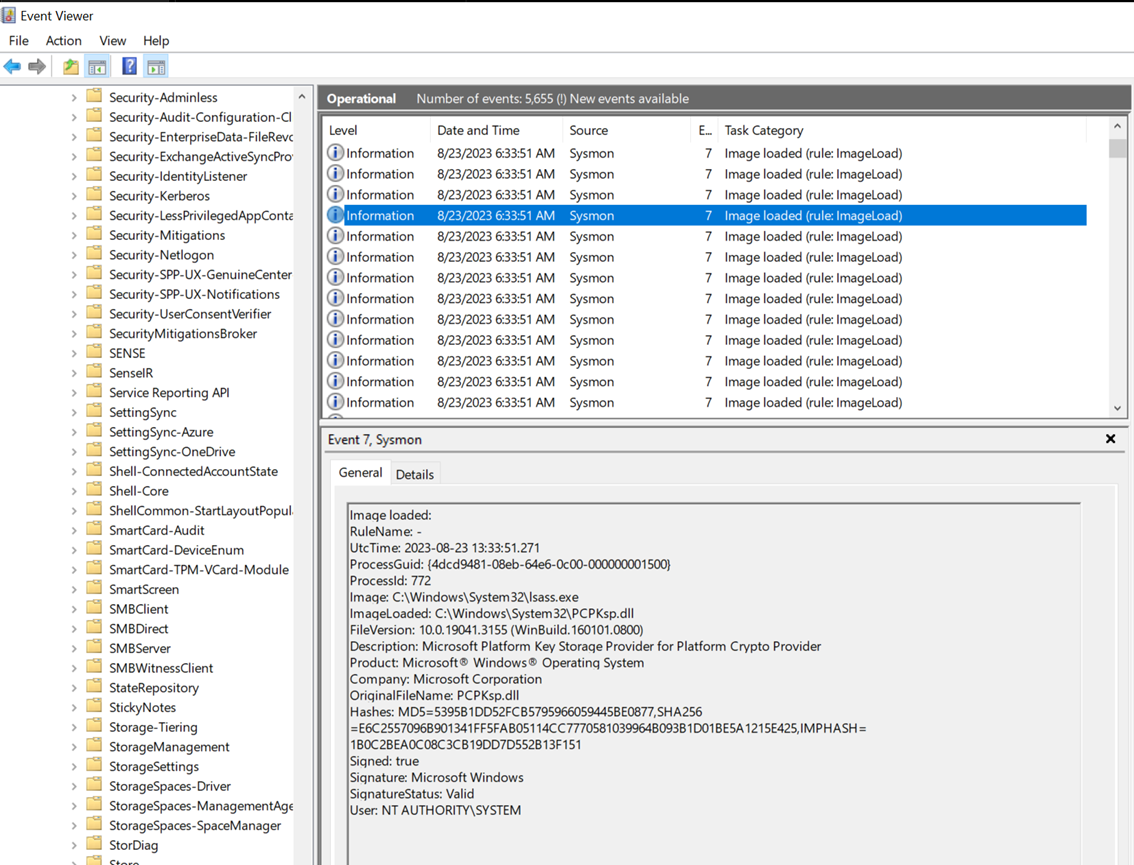
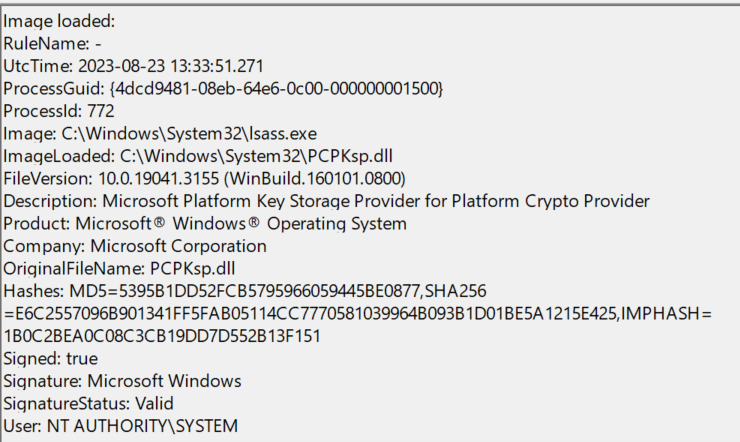
- The event log contains the DLL’s signing status (in this case, it is Microsoft-signed), the process or image responsible for loading the DLL, and the specific DLL that was loaded.
- We can see the path of the files
At now, we can see our example:
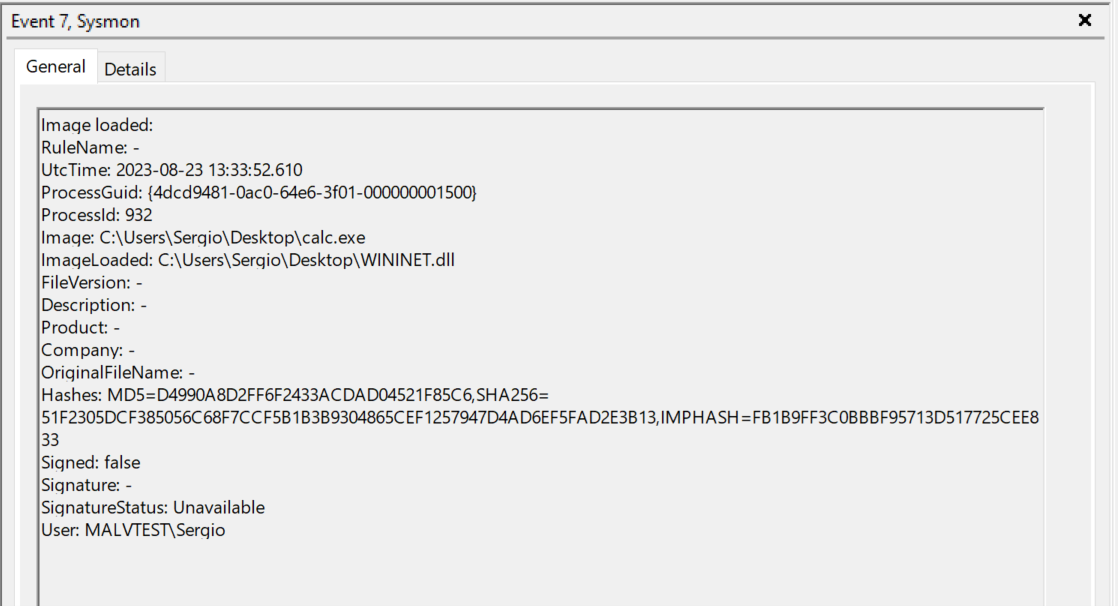
Let’s explore these IOCs:
-
“calc.exe”, originally located in System32, should not be found in a writable directory. Therefore, a copy of “calc.exe” in a writable directory serves as an IOC, as it should always reside in System32 or potentially Syswow64.
-
“WININET.dll”, originally located in System32, should not be loaded outside of System32 by calc.exe. If instances of “WININET.dll” loading occur outside of System32 with “calc.exe” as the parent process, it indicates a DLL hijack within calc.exe. While caution is necessary when alerting on all instances of “WININET.dll” loading outside of System32 (as some applications may package specific DLL versions for stability), in the case of “calc.exe”, we can confidently assert a hijack due to the DLL’s unchanging name, which attackers cannot modify to evade detection.
-
The original “WININET.dll” is Microsoft-signed, while our injected DLL remains unsigned.
These three powerful IOCs provide an effective means of detecting a DLL hijack involving calc.exe.
Detection Example 2: Detecting C-Sharp Injection
We can use execute-assembly with sliver, sliver spawn a notepad process by default.

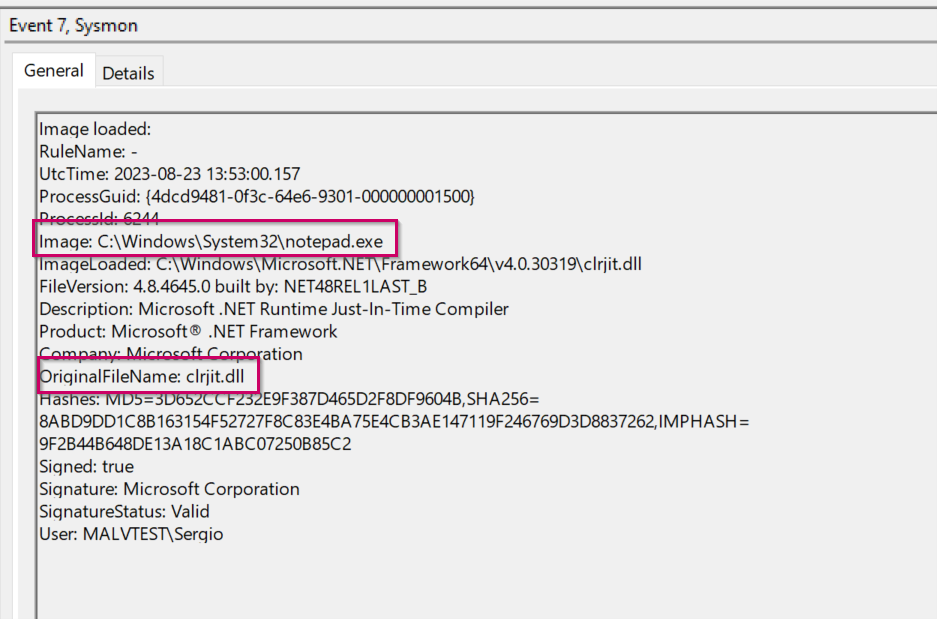
These DLLs are used when C# code is ran as part of the runtime to execute the bytecode
We can detect this tecniques with process hacker, we can increase the visibility time when a process is born/dies. You will see a multitude of sub-processes of your parent jump in the same colour. Very funny.
- Process is managed => Green Color
- We can find the new modules running (clr.dll & clrjit.dll)
Windows Event Logging
Windows event logging offers comprehensive logging capabilities for application errors, security events, and diagnostic information Event viewer uses the AdvApi32.dll library functions, ReadEventLog() to query the Windows Event Log. The default Windows event logs consist of Application, Security, Setup, System, and Forwarded Events.
Each entry in the Windows Event Log is an “Event” and contains the following primary components:
- Log Name: The name of the event log (e.g., Application, System, Security, etc.).
- Source: The software that logged the event.
- Event ID: A unique identifier for the event.
- Task Category: This often contains a value or name that can help us understand the purpose or use of the event.
- Level: The severity of the event (Information, Warning, Error, Critical, and Verbose).
- Keywords: Keywords are flags that allow us to categorize events in ways beyond the other classification options. These are generally broad categories, such as “Audit Success” or “Audit Failure” in the Security log.
- User: The user account that was logged on when the event occurred.
- OpCode: This field can identify the specific operation that the event reports.
- Logged: The date and time when the event was logged.
- Computer: The name of the computer where the event occurred.
- XML Data: All the above information is also included in an XML format along with additional event data.
Useful Windows Event Logs:
https://www.13cubed.com/downloads/windows_event_log_cheat_sheet.pdf
Evasion
1. Blind EventLog
Within the svchost.exe process, there are different threads running to execute the tasks of the EventLog service, if these threads are paused, no new events appear.
Constantly updated 😉
Update
More detection => https://www.elastic.co/security-labs/hunting-memory
More blind sysmon => https://tccontre.blogspot.com/2023/08/reg-restore-odyssey-journey-to.html?m=1
Thanks to:
- Matej Havranek - Attacks on Event Tracing for Windows: Techniques and Countermeasures
- Ruben Boonen - Direct Kernel Object Manipulation (DKOM) Attacks on ETW Providers
- Claudiu Teodorescu - Igor Korkin - Andrey Golchikov : Veni, No Vidi, No Vici: Attacks on ETW Blind EDR Sensors
- ATTL4S & ElephantSe4 - UNDERSTANDING AND HIDING YOUR OPERATIONS
- Pavel/Alex/Mark/David for Windows Internals and for all the knowledge they share
- Andrei miroshnikov for Windows Security Monitoring
-
waldoirc for his lab Windows Event Logs & Finding Evil
-
Noora Hyvärinen for Detecting Parent PID Spoofing
- Scott Nusbaum for PPID Spoofing: It’s Really this Easy to Fake Your Parent